 |
|||||||||||||||
|
The first computer-aided distribution atlas of butterflies (HEATH 1970) was published about 30 years ago. The subsequent utilisation of modern computers has opened new ways in the use, application and interpretation of distribution data. Essentially, interlinked applications of two programs comprising a distribution data input program and a graphic program drawing distribution maps are necessary. Back in 1996, Microsoft Access for Windows 95 as the data input program and the DMAP for Windows (by A. MORTON) as the graphic program were selected for MEB. About two years later the Access application proved unstable, quite difficult to use and the link to the DMAP never worked properly. In the end the author of the Access application became unavailable. After a few heavy crashes, followed by some loss of data, a new way had to be sought. Following consultations with M. MAIER (MEB recorder M29 and a professional IT) contact was made with K. LUX (another MEB recorder, L20, and a professional program developer), who most kindly wrote a completely new distribution data input program and linked it to the DMAP and continues to maintain both applications. K. LUX and A. MORTON describe the MEB computer background as follows:
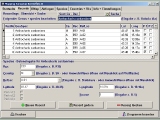
Practically all data delivered by recorders were to be fed manually into a database to facilitate computer-aided evaluation. The manual input of the anticipated huge amount of data is only possible if robust software can be used. There is no standard software on the market which could meet all the specific requirements of such mass data input. Therefore, the decision was made to develop a new tailor-made software package. O. KUDRNA contributed the ideas and requirements for this software, which is called Mapping European Butterflies (MEB).The main requirements for the MEB software were as follows:
The MEB software was developed in April 1999 by K. LUX and is being improved continuously. The initial development was made possible in a very short time with the help of modern software tools: Borland Delphi 3 was the first choice. It is a graphical software developing environment for Microsoft Windows programs. It was decided to use a common database Paradox for storing the anticipated more than 100.000 records. Paradox also facilitates import and export of data from/to other databases such as Microsoft Access or dBase.
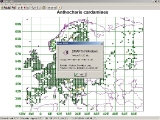
DMAP is a Windows program written by A. MORTON for the production of high-quality distribution maps. It can produce distribution maps of any area at any scale using a variety of symbol types to display the distributions. In addition to distribution maps, it can produce frequency maps and coincidence maps which can be used in biodiversity analyses and studies. The maps can be printed at high resolution in full colour or black and white, and the maps can be exported in a variety of image formats to other software. Data for DMAP can be entered into a simple text file, a spread-sheet, a general database, or a biological recording base. The data can consist of latitude/longitude co-ordinates or a variety of metric co-ordinates such as UTM or national grid references. The projection of the DMAP map is equidistant cylindrical with the standard parallel at 51°N. Regrettably, the DMAP version used in this project does not fulfil the following requirements important in the course of producing the camera-ready copy of the atlas:
|
|||||||||||||||


 Email to Webmaster